
Famine: What I learned from coding the model and a sensitivity analysis
Why a little more hunger can lead to a lot more catastrophe

As detailed in the past three posts explaining my open-source reconstruction of the Clingendael Institute model of famine in Sudan, I have been putting some work into understanding how this kind of resource-scarcity model works. I have perhaps been trying the patience of readers as I lay out the modeling assumptions and approach, but I hope it will be useful to others and ultimately help people to better understand the current crisis in Sudan and think about what needs to be done and just how urgent it is. So what have I actually learned from this?
Of course, in a general way I’ve learned a lot about famine and the response of critical actors, but I want to share three particular insights that we’re not obvious or intuitive to me before I started the project, based also on a basic sensitivity analysis of the model. While I focus on substantive implications first, for people interested in the technical aspects and the code to replicate or play with the sensitivity analysis, the details are provided below.
Three key takeaways
1. Famine and exponential disaster
I'm going to assume that I'm not the only person from rich countries who hasn't experienced prolonged hunger nor really thought or studied its effects on the human body. Naively, having read about people going hungry in books (to the extent I ever thought about it at all), I would have thought that enduring hunger for a longer period, such as sixth months or a year, would be more of a hardship than one month in the way a twelve hour bus ride is more of a hardship than a one hour bus ride, or going off social media for a year is harder than going off social media for one month. The implicit mental model is that the effects are additive, or perhaps even less so, because your body or expectations adapt.
Working with the data, it is clear that this is not the dynamic at play in an extended crisis like what is going on in Sudan, Yemen, Gaza, etc. In the short-term, there are many ways that individuals and communities can adapt that aren't necessarily sustainable, ranging from consuming stocks, consuming wild foods, sharing or borrowing, purchasing from abroad or other regions, eating seed grains, etc. In a situation of chronic lack of access to food, however, the problem may compound as these resources are depleted. And fundamentally, as is key to the model, over time people use up more and more of their reserves of fat, muscle, etc, until their body-mass index becomes so low that the probability of death starts approaching 1. While it is true that the body adapts somewhat, as seen in the equations for caloric deficit, we also see that excess mortality raises exponentially with lower body mass (For the graph, see the earlier post here. So the extension of a situation of food insecurity that has lasted, say, two years, by another two months might mean not 8% more death, but two or three times more deaths, as seen in this illustration:
")
2. Approaches to short- vs long-term hunger
Related to point 1, the difference between an acute food crisis and a prolonged, chronic lack of food generates different dynamics within the model. In a short-term crisis, food should clearly go to the poorest of the poor, as one just needs to get them through the crisis. In a multi-year situation, however, small efforts to increase calories slightly are insufficient. Over time people lose more and more weight, so shifting some food to the poorest of the poor can only prolong, but not save, their lives. This can be seen in the sensitivity analysis (below), where I change the floor of the calories received by the poorest members of society, which has essentially zero effect on excess mortality rates at the end of three years. So while crisis are important, I wish people could understand the importance of the cumulative effect of insufficient nutrition on people's health, critically the health of infants and children, but also on how this could lead to an impending disaster as the conflict drags on and not enough food aid is being delivered.
3. Famine and invisibility
Despite much reflection, I still find it mysterious that the prediction of millions of deaths from famine in Sudan that shocked me into delving into this project hasn't generated more discussion. While there are technical indicators suggesting famine in some areas, I think the lack of visibility is one of the key problems. One reason for this is that the RSF and other armed groups have specifically targeted journalists and thus made it difficult to get good coverage. But I think another aspect is the nature of the dynamics of famine which begin by affecting the most marginalised members of society and for the reasons I note above might surprise us in the way they spread rapidly.
It's hard not to think of the parallels with Covid, in the sense that transmission followed very clear, simple patterns of exponential growth, but the effects were not widely perceived until they appeared to burst on to the scene. I was living in France, and to simplify we can identify three stages: One occurred when I read on Twitter that the virus was on an exponential growth curve exactly like Italy, with just one week delay, and so while no one in France thought it would arrive, the data said it was coming. I asked my students how many thought our class might be disrupted by Covid before the end of the semester and only 1-2 out of 60 hands were raised. A week later, France was in lockdown. But the phase (or first) phase, was that actually the virus had been circulating for more than a month beforehand, unbeknownst to anyone, going back to at least January 24th in France. During that time it was causing deaths, but as those deaths were e.g., among the elderly population, and no one realized anything was out of the ordinary. Even in rich countries such as the US, there are people who do not get enough to eat, leading to an estimated 20,500 deaths in the U.S. in 2022.1
Sudan might be in this first or second phase, where already tens of thousands of people are dying of hunger and hunger-related diseases, but it's not really on the radar, in particular as one expert points out, because the surveys that are done tend to miss some of the most marginalized, and non-stationary members of the community. Hunger also generally leads to excess mortality indirectly, through people dying of communicable diseases.
Finally, it's also worth noting that the indicators on famine are really based on large-scale effects, that is, the technical "famine" classification (Phase 5) requires 20% of households to face an extreme food shortage, AND 30% of the population suffers from wasting, AND 2 in every 10,000 people die per day from hunger-related causes (and note that this definition has been reached in Sudan for certain areas that include over 100,000 people). But we should also appreciate the danger of a 'lower-grade' problem, which would still be catastrophic, with a death toll that would shock if it were inflicted by weapons instead of hunger. For example, if there are only 1 excess death per day per 10,000 in, say, half the Sudanese population, that still translates to 2,430 deaths per day and 887,000 people in a year. Of course, like with Covid, nothing is written in the (statistical) stars - what happens next will depend on whether the conflict continues (currently looks likely), and whether the international community can do more to promote the arrival of aid.
Sensitivity Analysis
I have tried to make as clear as possible the various assumptions and inputs on which the predictions depend in this now 4-part series. While I hope transparency can increase confidence in the model, it might also make some people wonder how robust the model is to variations in these inputs, and which inputs are the most responsible for changes in outcomes. This is the purpose of a sensitivity analysis, here using the Sobol method, a variance-based approach, to determine which input factors most significantly impact excess mortality.2
As a starting point, I chose five inputs to consider:
1. More food: What if the amount of available food was up to 10% more than baseline projections (corresponding to a 6x increase in food aid, or greater harvest results, etc.)
2-3. Two technical parameters that are part of the equation for modeling how caloric deficit affects BMI (‘factor_deficit’, ‘factor_adj’, details in this post)
4. the amount of inequality in the distribution of food (basically the slope of a linear function of the percentiles, ‘beta1’, details here)
5. the minimum amount of daily food distributed to any group (‘distrib_kcal_min’)
Sensitivity analysis: results
First, let's talk about what would be the worst case scenario. From a modeling point of view, it would be disheartening if the model produced wildly different outputs based on (multiple) input parameters that are both inscrutable and hard to pin down with data.
Instead, however, the Sobol indices suggest that the amount of available food (‘grain_multiplier’) is overwhelmingly the most influential factor, accounting for over 70% of the variation in excess mortality, followed by the inequality of the distribution of the food (‘beta1’).
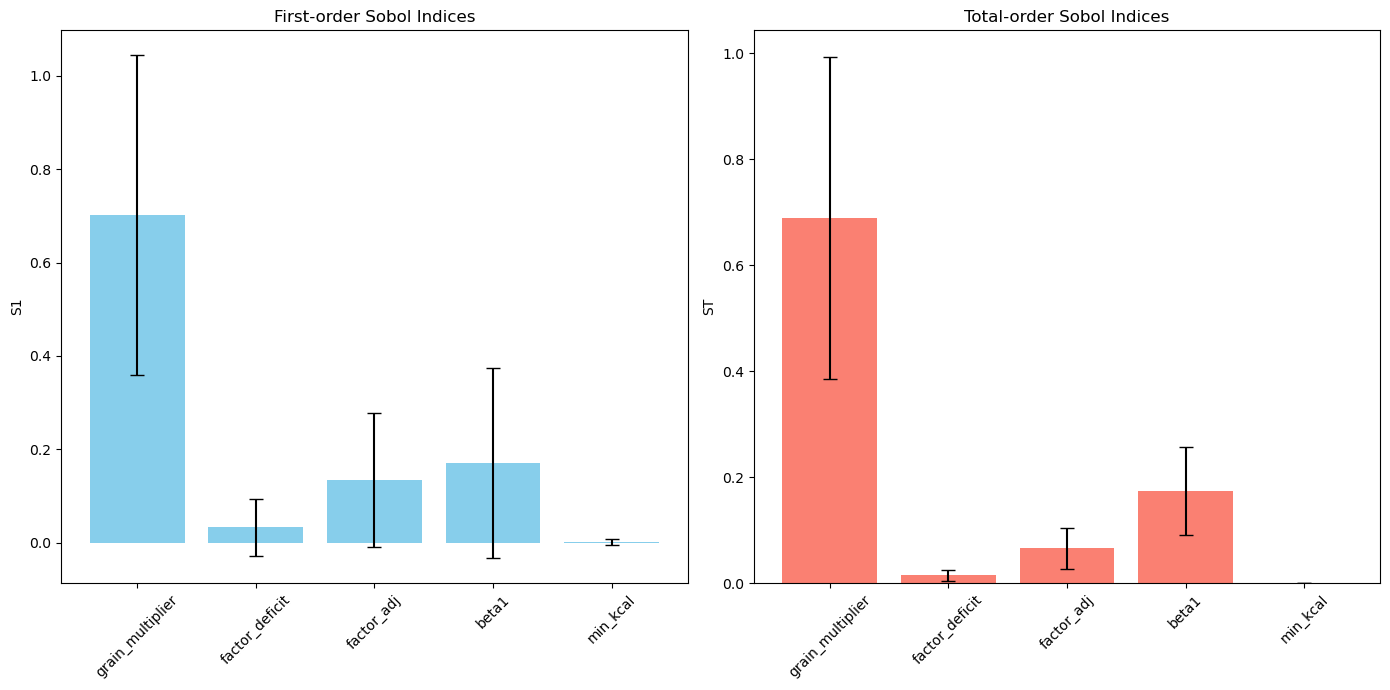
Another way to interpret the relationships is to look at scatterplots of inputs and outputs. If a variable is uninfluential, the plot will just look like a generic cloud, while a strong relationship can be seen for example in the plot for the amount of food (top left). As usual, I provide a Jupyter notebook here for people who want to play around with the model themselves, or add other variables or variable ranges in the sensitivity analysis (and note that changing the range of a variable or which variables are included can affect the ranking of importance).
Thus, while a more comprehensive analysis needs to be done, the preliminary results suggest the model is not overly sensitive to small changes in parameters for e.g. the calculation of BMI changes,3 and reinforce the intuition that additional food aid can be essential to reducing excess deaths.

Note that this includes not only lack of access to food but not eating food with the proper nutrients. Also, the problem may have been especially bad in this time period because food programs to aid the needy were shut down due to Covid. US News (citing the U.S. Centers for Disease Control and Prevention, "U.S. Malnutrition Deaths Have More Than Doubled" April 13, 2023.
For more information, see Saltelli, et al. 2007. Global sensitivity analysis: a primer chapters 1 and 4.
This is is not surprising given that as I have argued, the cumulative effect of insufficient food overwhelmes other differences, even though it does not do so immediately, as seen from the weaker effect between food availability and excess mortality in year 1 and year 2, seen in the leftmost plots below the top plot.